Financial Technology & Data Analytics Blog
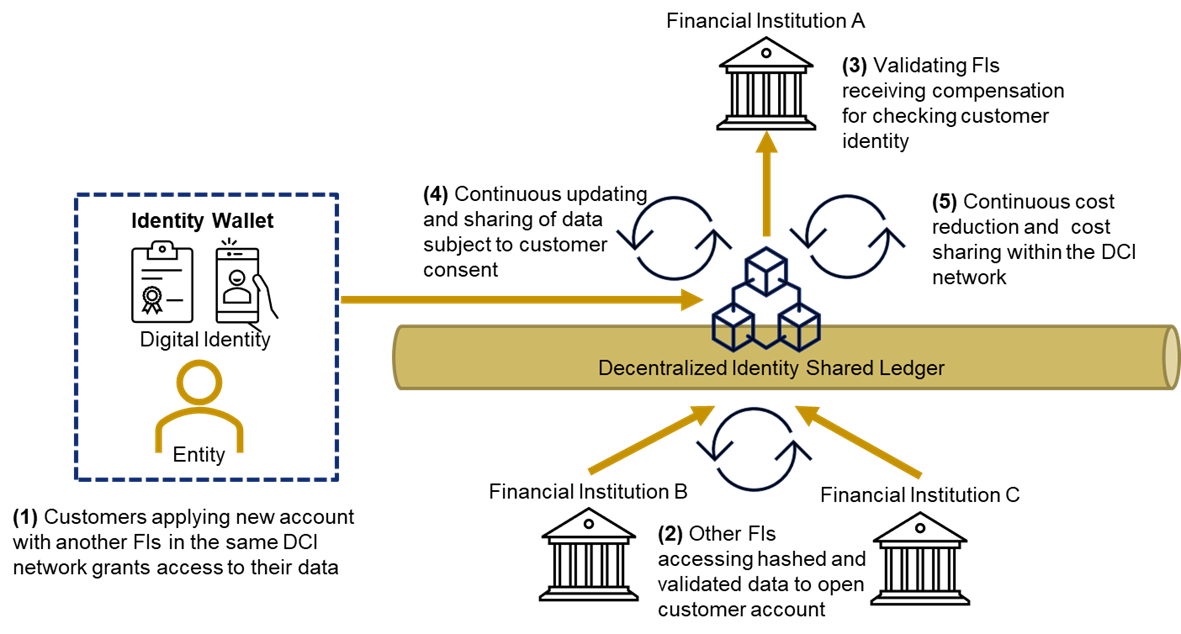
BYOI DCI KYC
Validated Bring Your Own Identity Blockchain Solution for Customer Onboarding
Adara Challenge Analysis
Technical Analytical Assessment for Field Data Science team
V-ASK User Guide
A step-by-step guide on how to use V-ASK App.
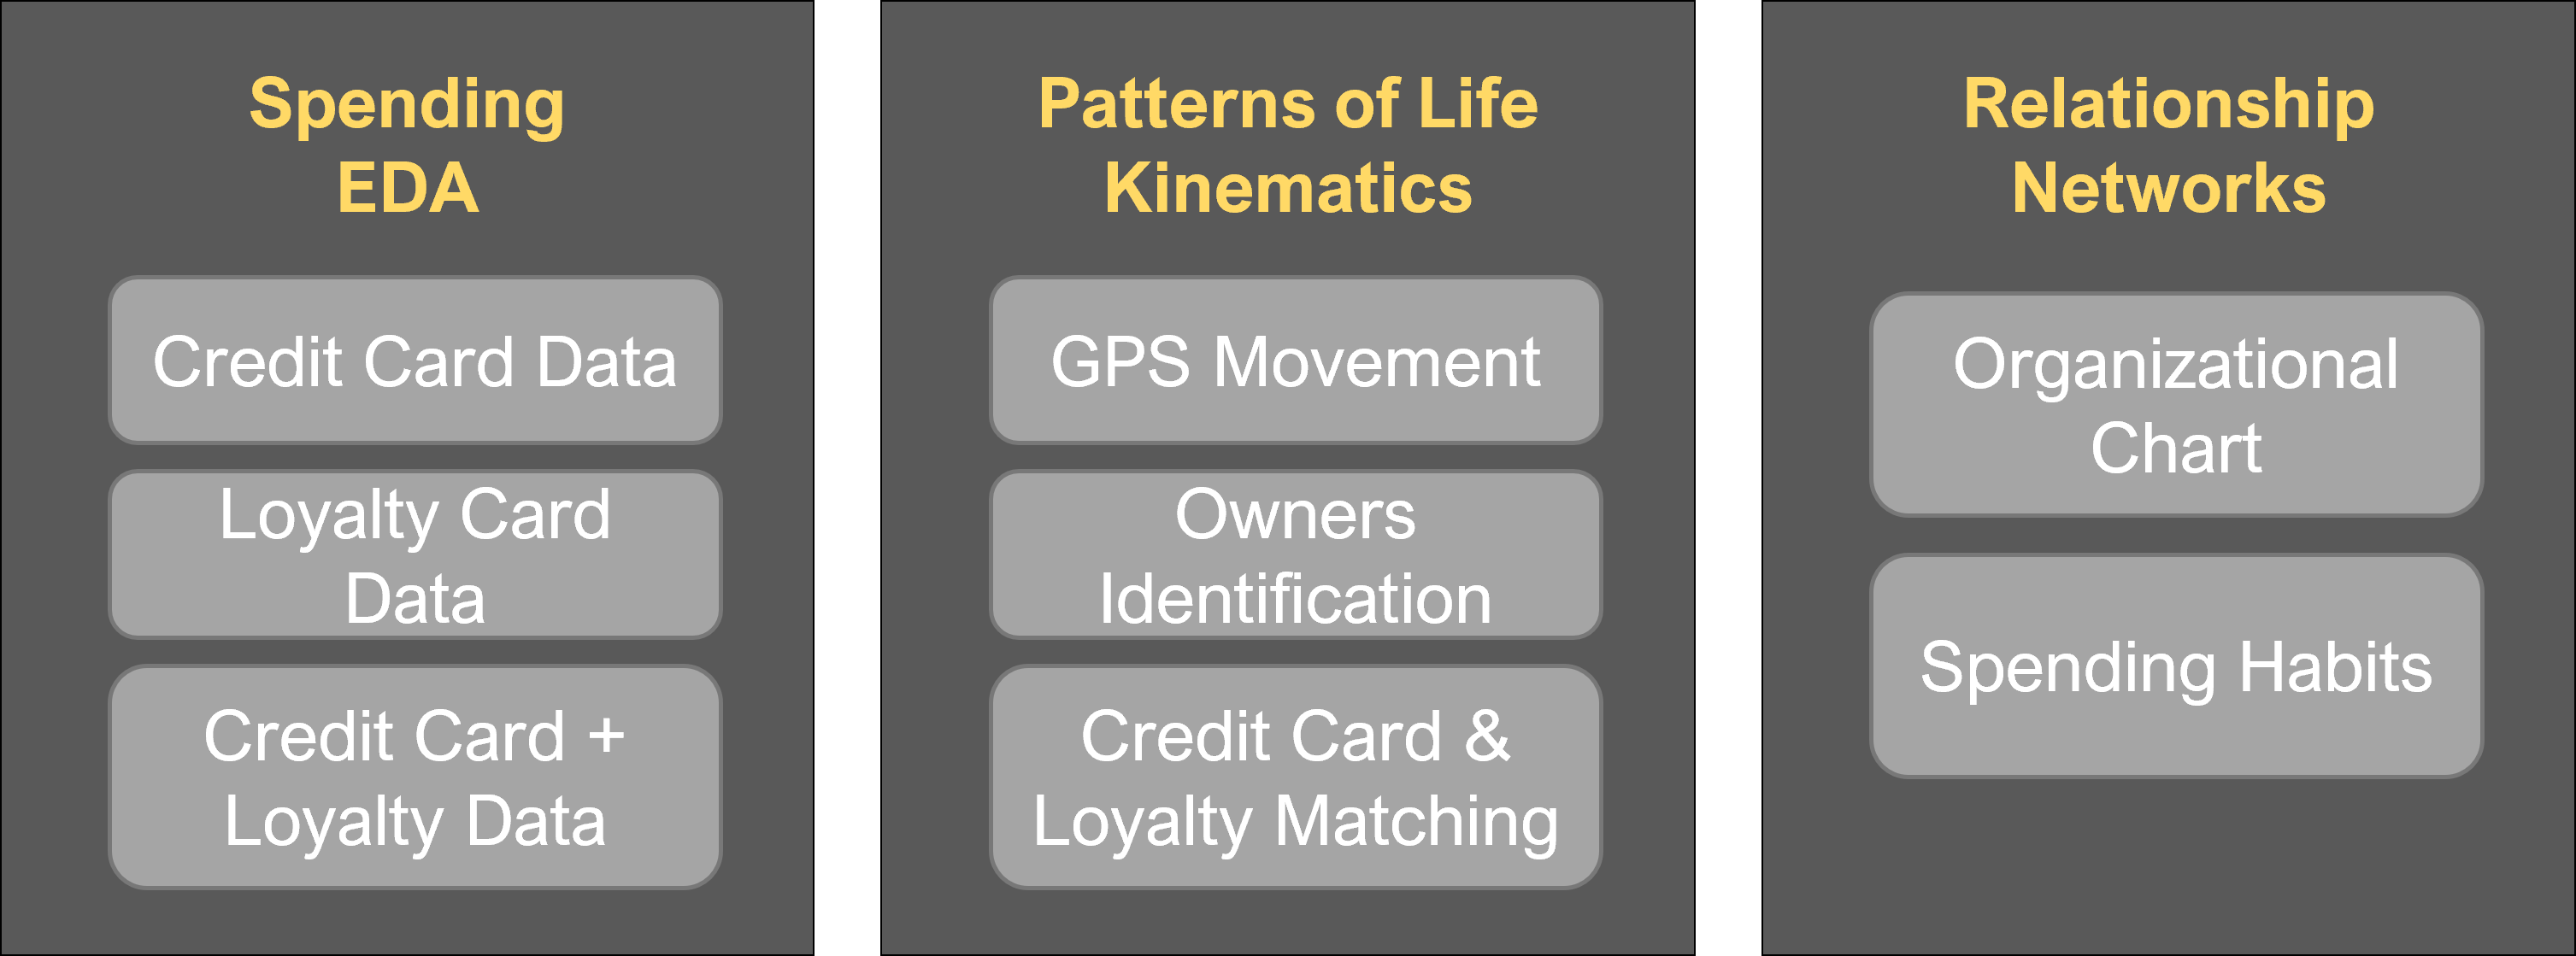
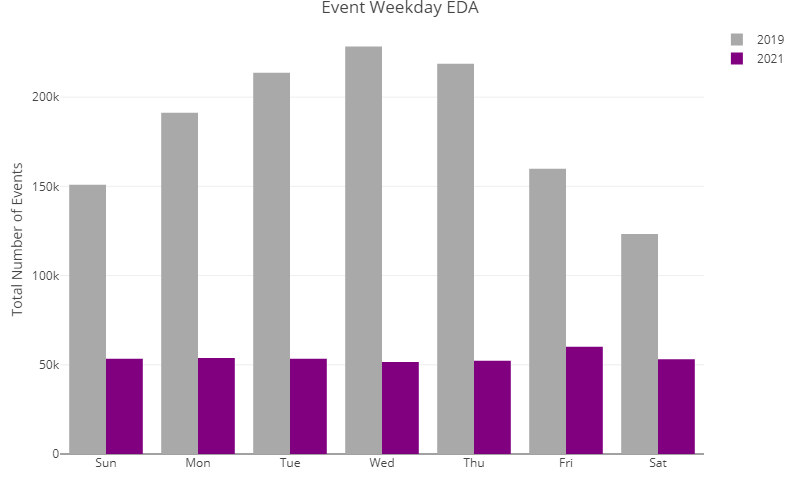
V-ASK: Visual Analytics of Spending and Kinematics
An application to explore and identify anomalies and suspicious activities. View the R Shiny App using this [link](https://adolit.shinyapps.io/v-ask/)

Visual Detective Assignment
This assignment attempts to solve the 2021 IEEE Visual Analytics Science and Technology (VAST) Challenge: Mini-Challenge 2 by applying different visual analytics concepts, methods, and techniques with relevant R data visualisation and data analysis packages.
Visual Detective Assignment Part 2
This assignment attempts to solve the 2021 IEEE Visual Analytics Science and Technology (VAST) Challenge: Mini-Challenge 2 by applying different visual analytics concepts, methods, and techniques with relevant R data visualisation and data analysis packages.

Visual Detective Assignment Part 3
This assignment attempts to solve the 2021 IEEE Visual Analytics Science and Technology (VAST) Challenge: Mini-Challenge 2 by applying different visual analytics concepts, methods, and techniques with relevant R data visualisation and data analysis packages.

Visual Detective Assignment Part 4
This assignment attempts to solve the 2021 IEEE Visual Analytics Science and Technology (VAST) Challenge: Mini-Challenge 2 by applying different visual analytics concepts, methods, and techniques with relevant R data visualisation and data analysis packages.

Visual Detective Assignment Part 5
This assignment attempts to solve the 2021 IEEE Visual Analytics Science and Technology (VAST) Challenge: Mini-Challenge 2 by applying different visual analytics concepts, methods, and techniques with relevant R data visualisation and data analysis packages.
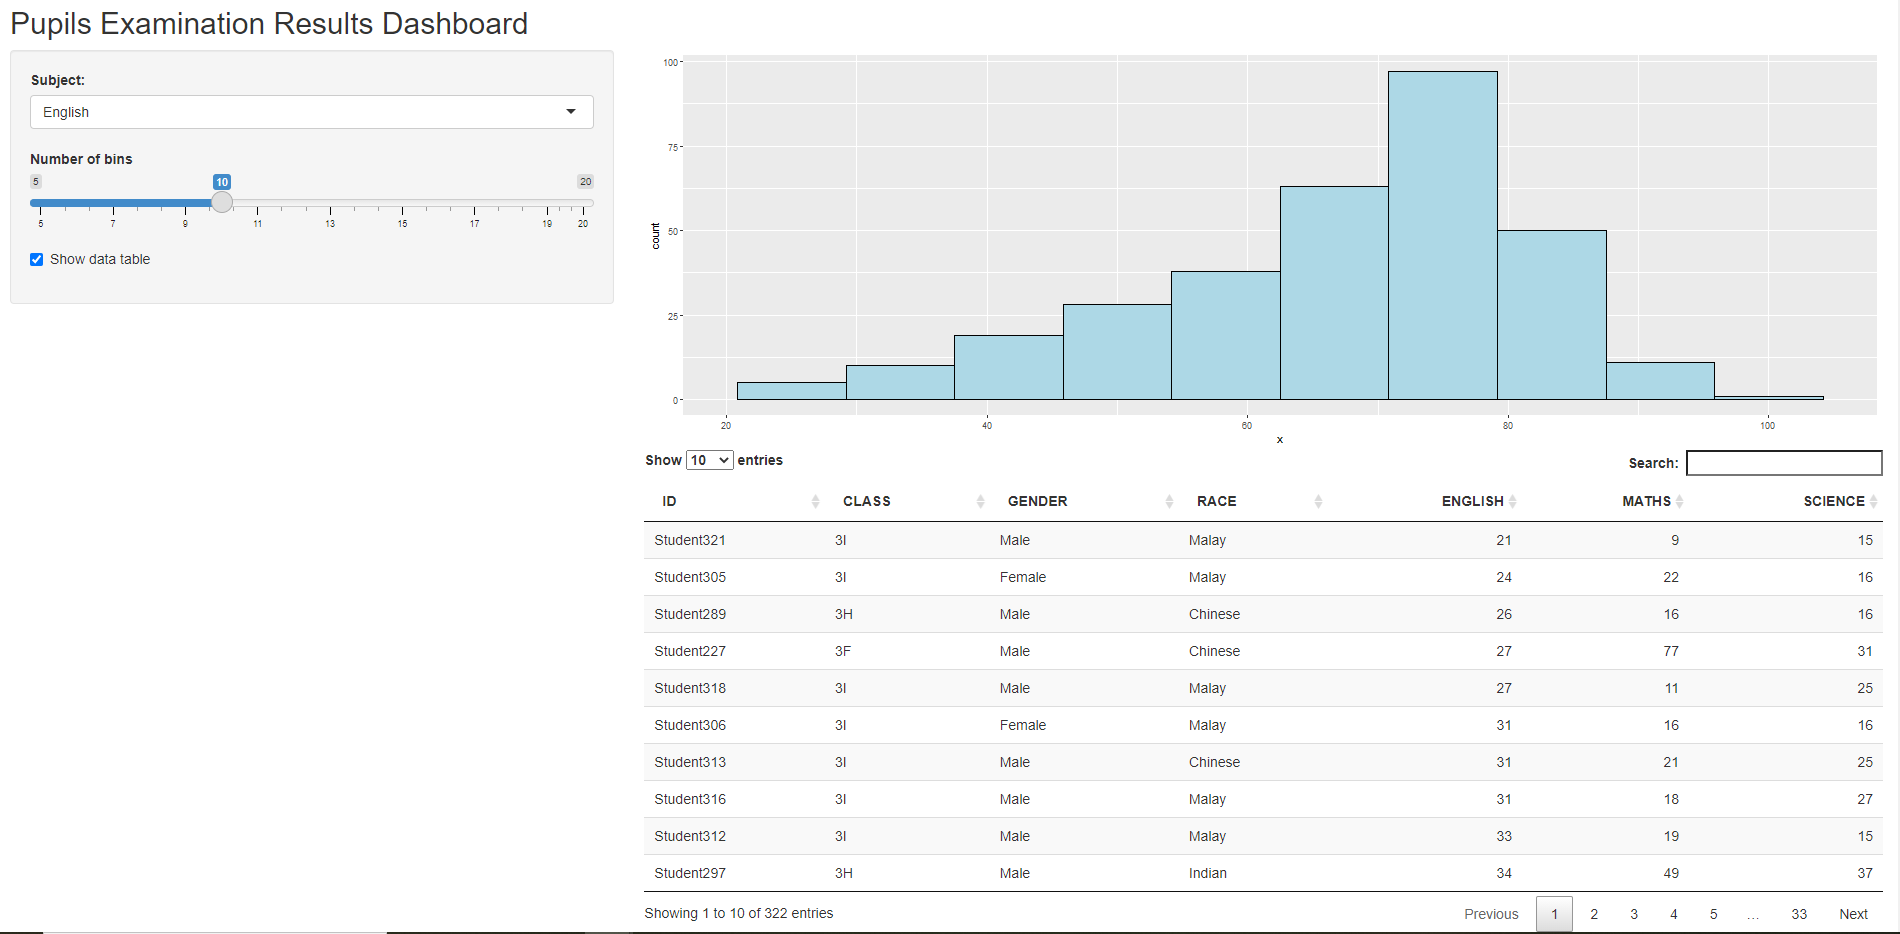
Getting to Know Shiny
This in-class exercise introduces Shiny as an example of web-enabled visual analytics application.
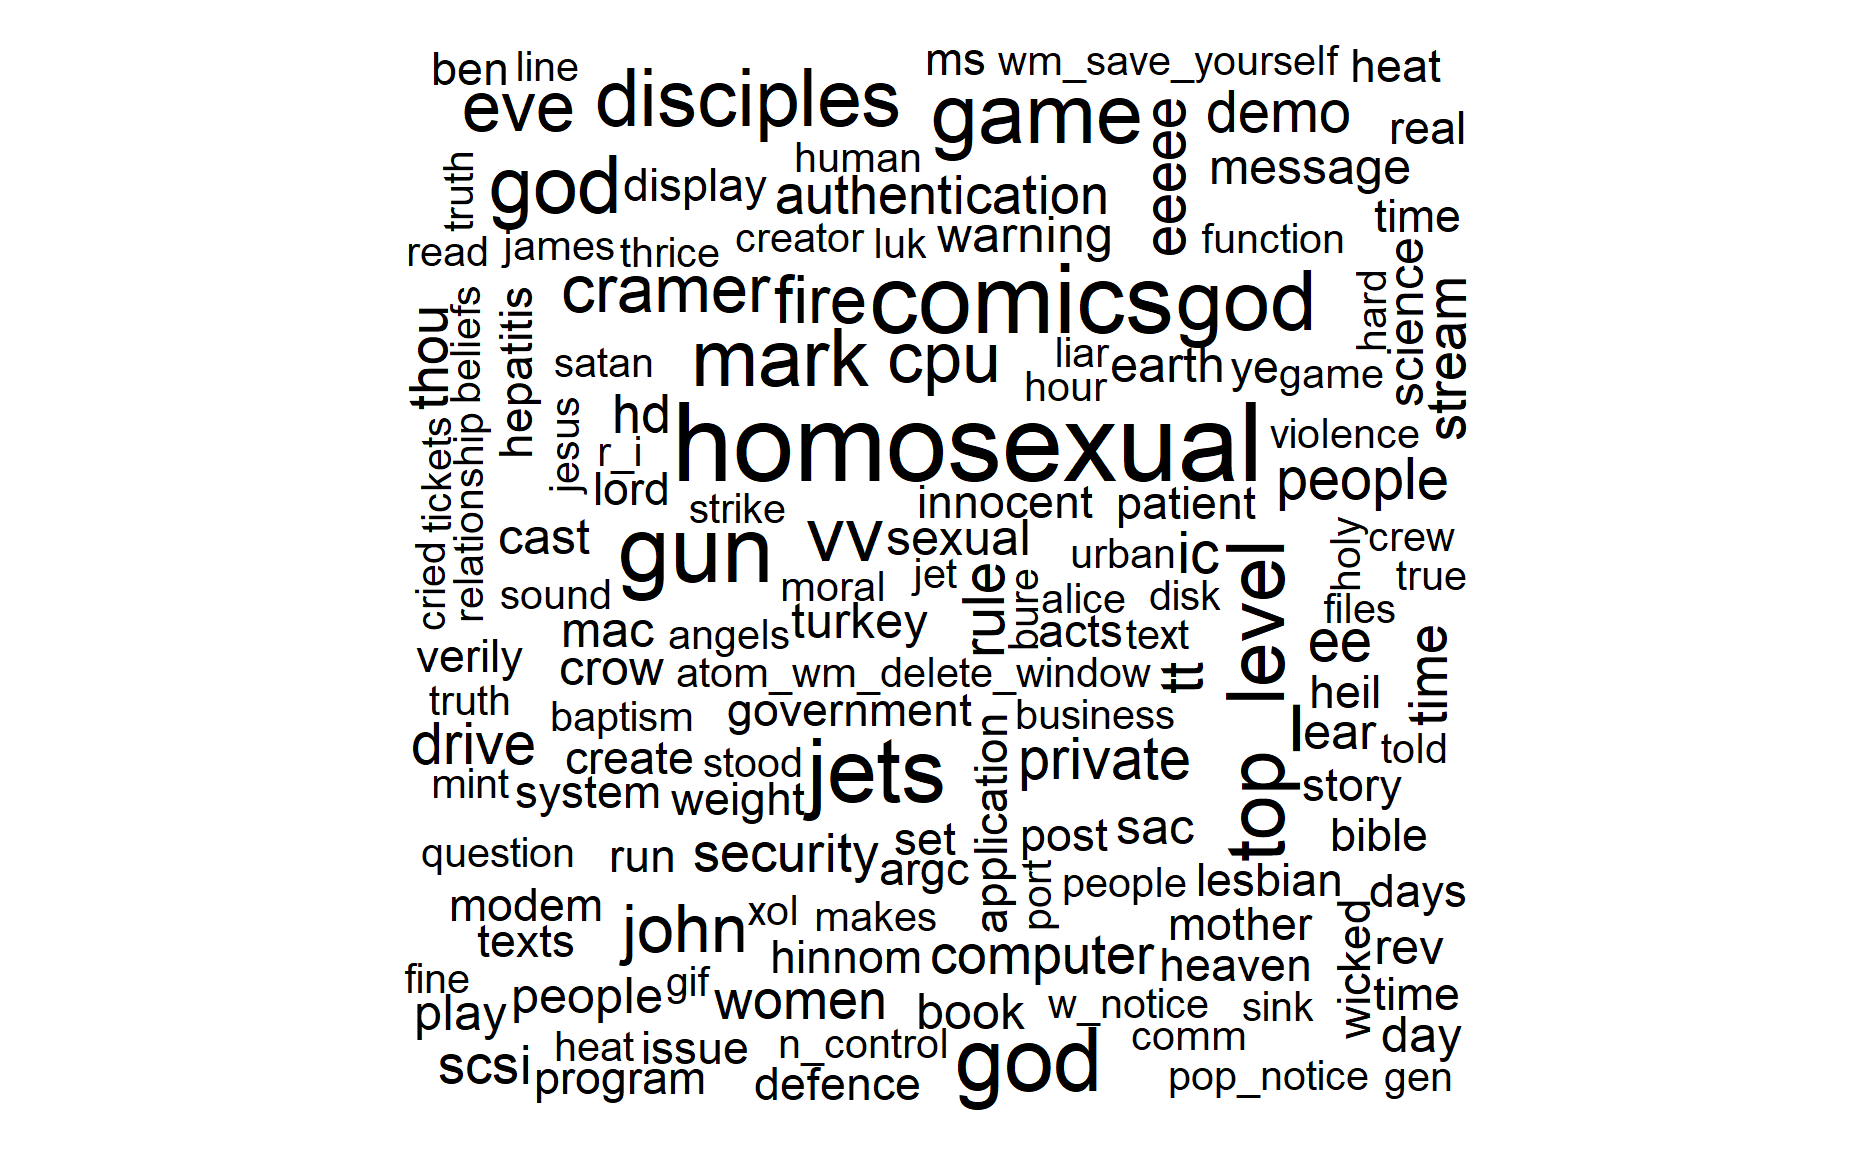
Text Visual Analytics with R
This in-class exercise explores the concepts and methods of Text Visualisation. It visualises and analyses the text data from a collection of 20 newsgroups. It introduces the tidytext framework for processing, wrangling, analysing and visualising text data using tidytext, tidyverse, widyr, wordcloud, ggwordcloud, textplot, DT, lubridate, and hms packages.
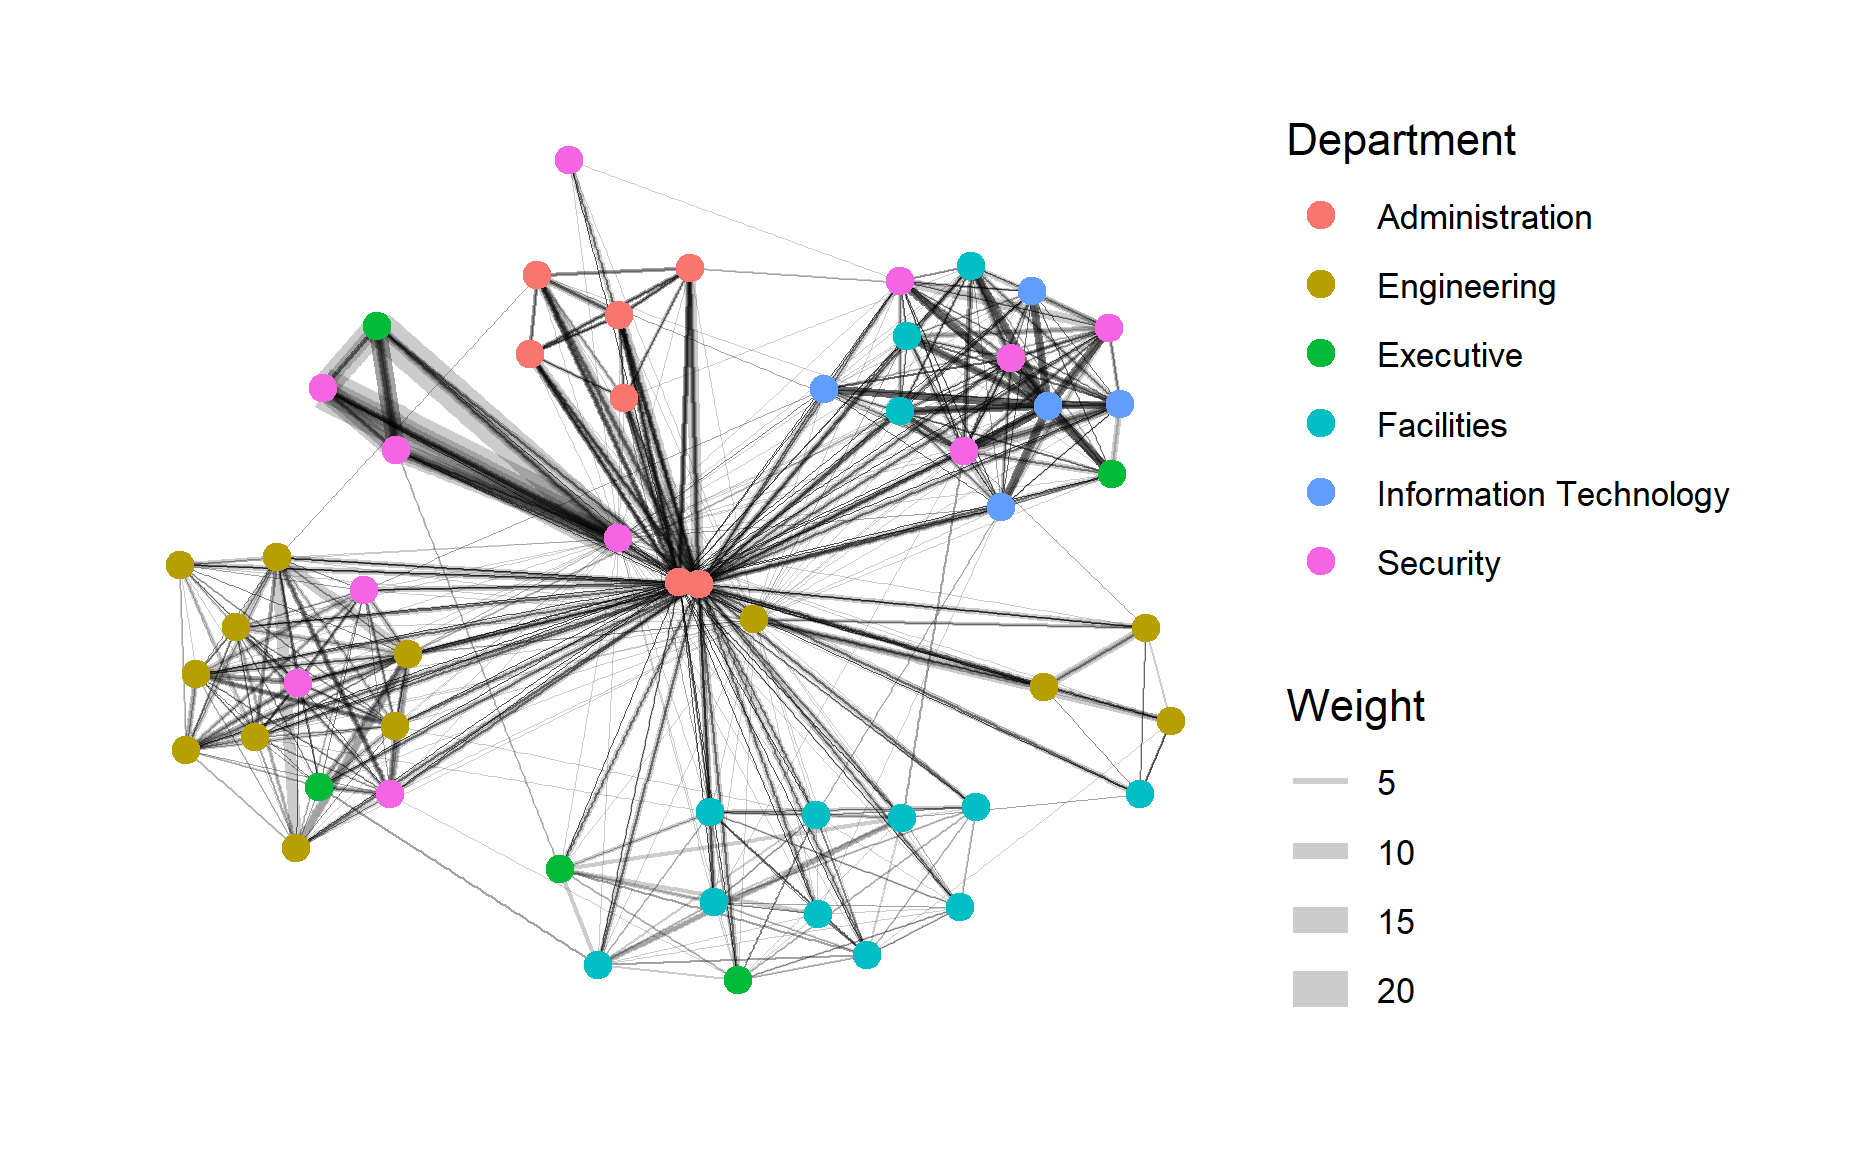
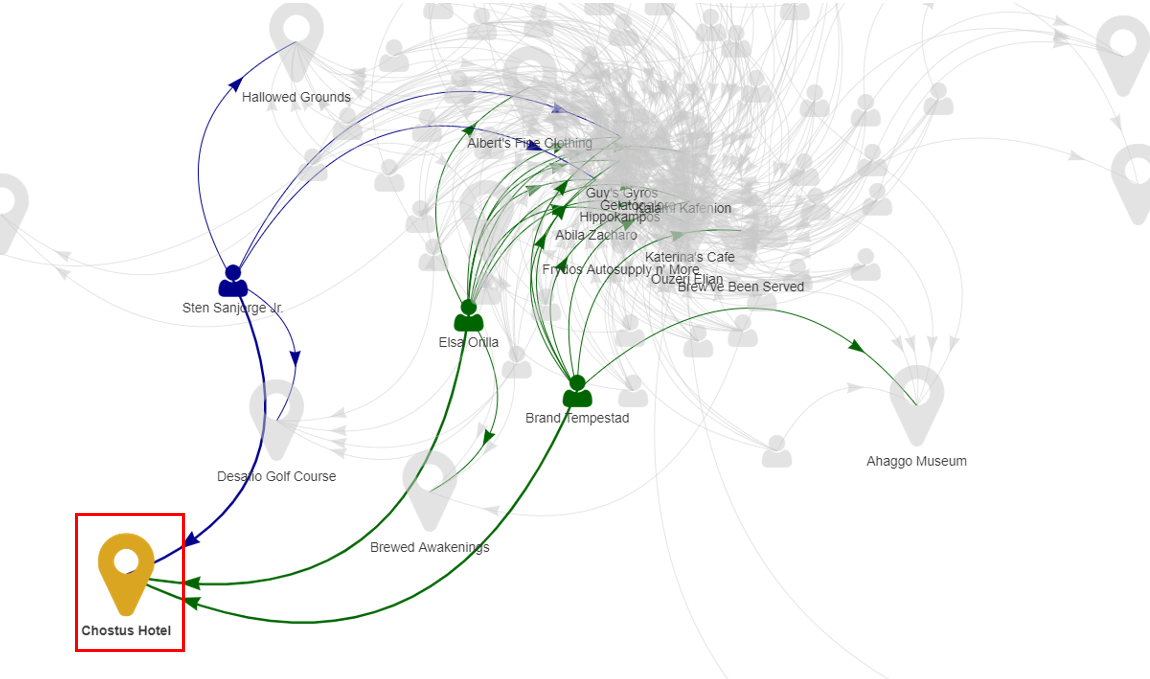
Network Data Visualisation and Analysis with R
This in-class exercise explores Network Data Visualisation and Analysis. It visualises the GASTech emails from VAST Challenge 2021: [Mini-Challenge 1](https://vast-challenge.github.io/2021/MC1.html) using dplyr, lubridate, tidygraph, ggraph, and VisNetwork packages. Additionally, the cc_data.csv from VAST Challenge 2021: [Mini-Challenge 2](https://vast-challenge.github.io/2021/MC2.html) was used to create Bipartitle Network.
Programming GeoVisual Analytics with R
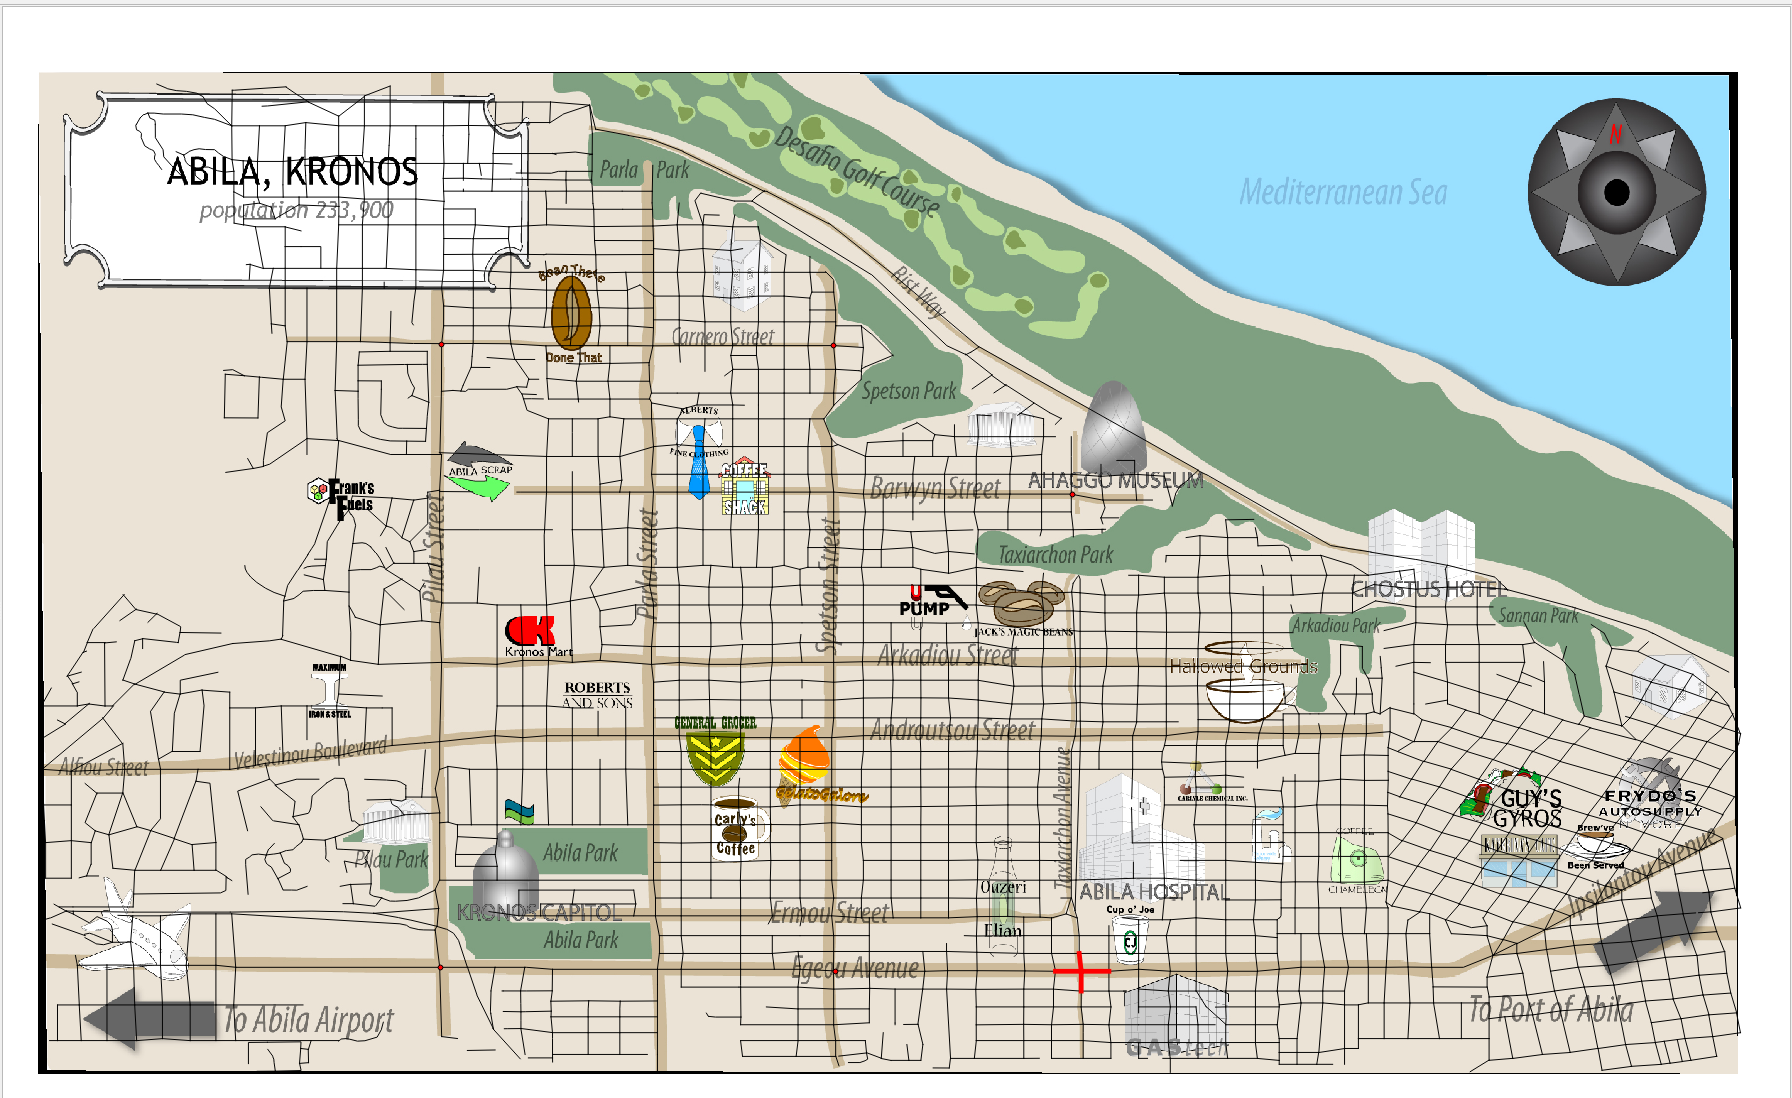
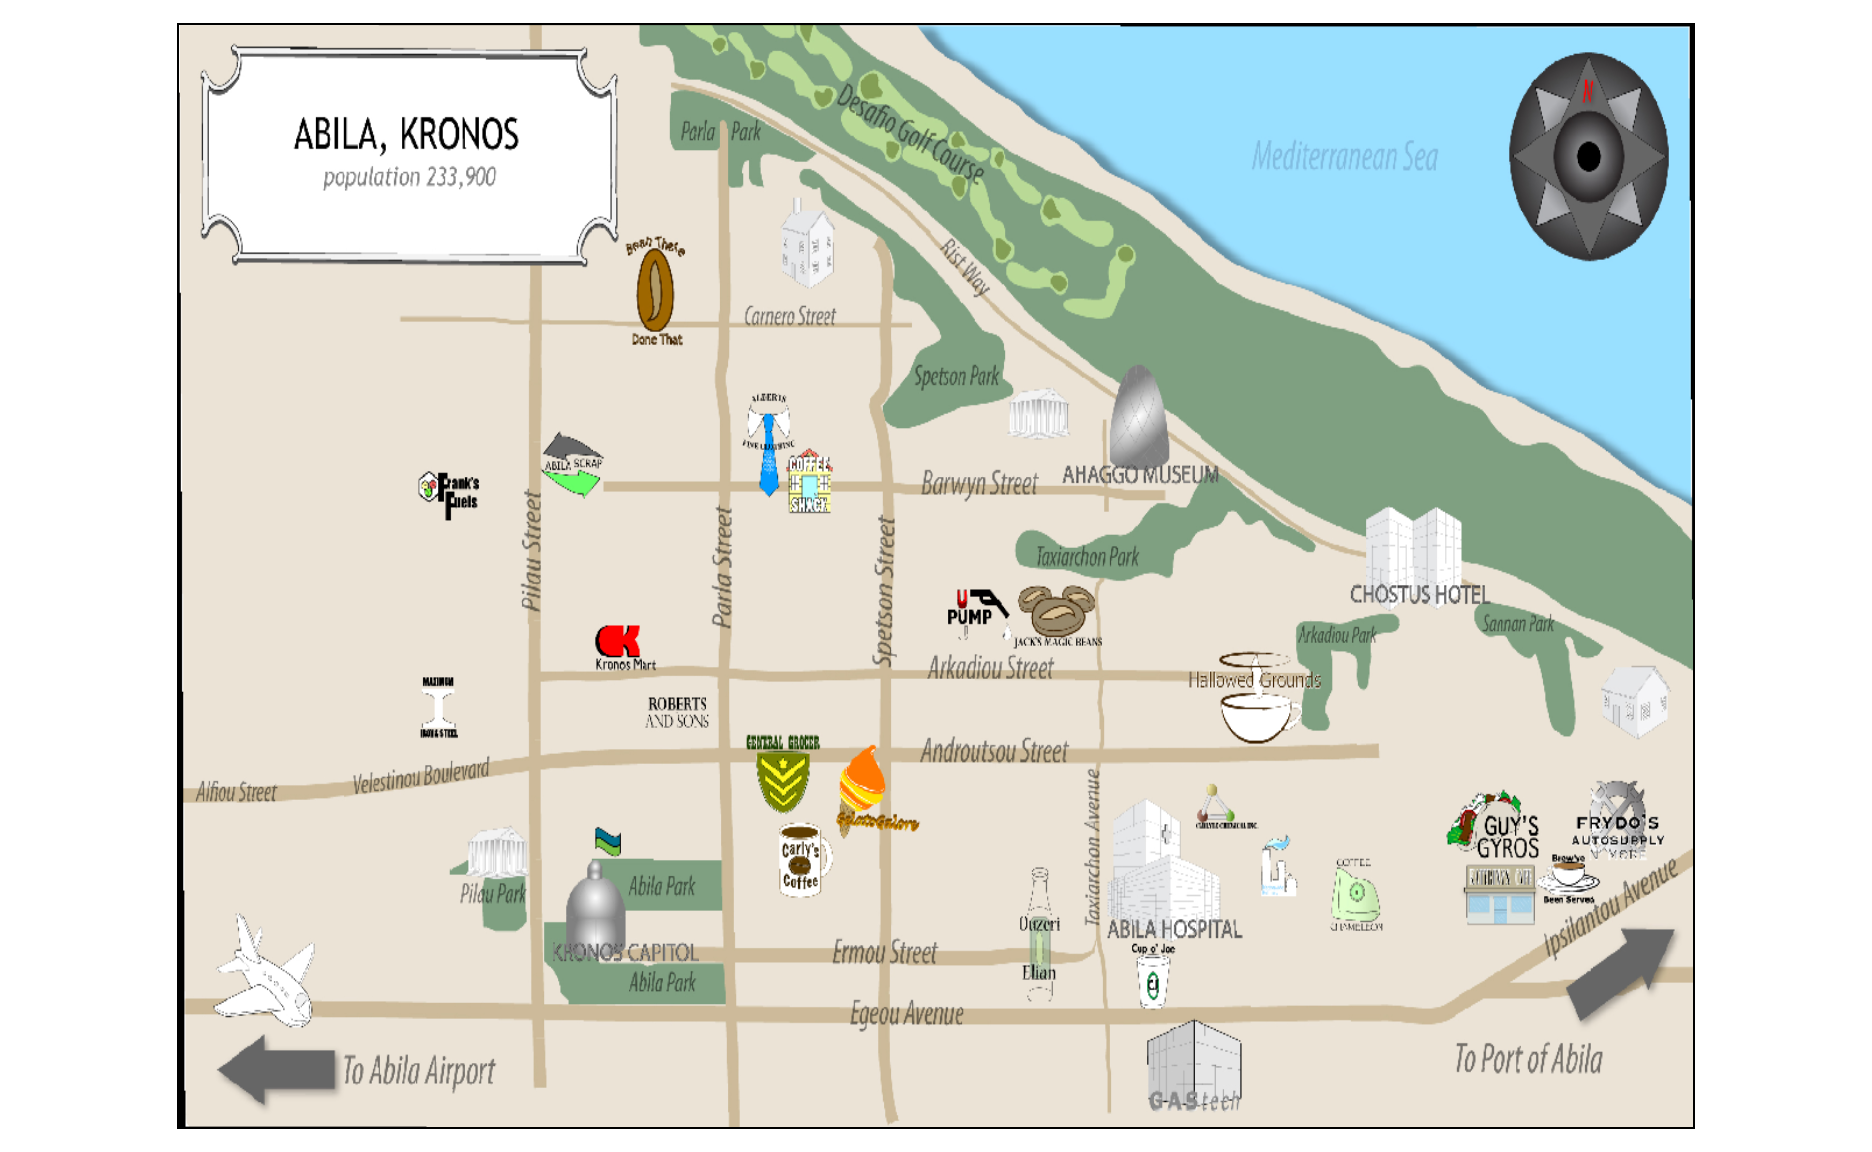
This in-class exercise explores Analysis of Spatial Data. Specifically, it visualises the movement data from VAST Challenge 2021: [Mini-Challenge 2](https://vast-challenge.github.io/2021/MC2.html) using sf, raster, readr, clock and tmap packages.
Programming Data Visualisation in R
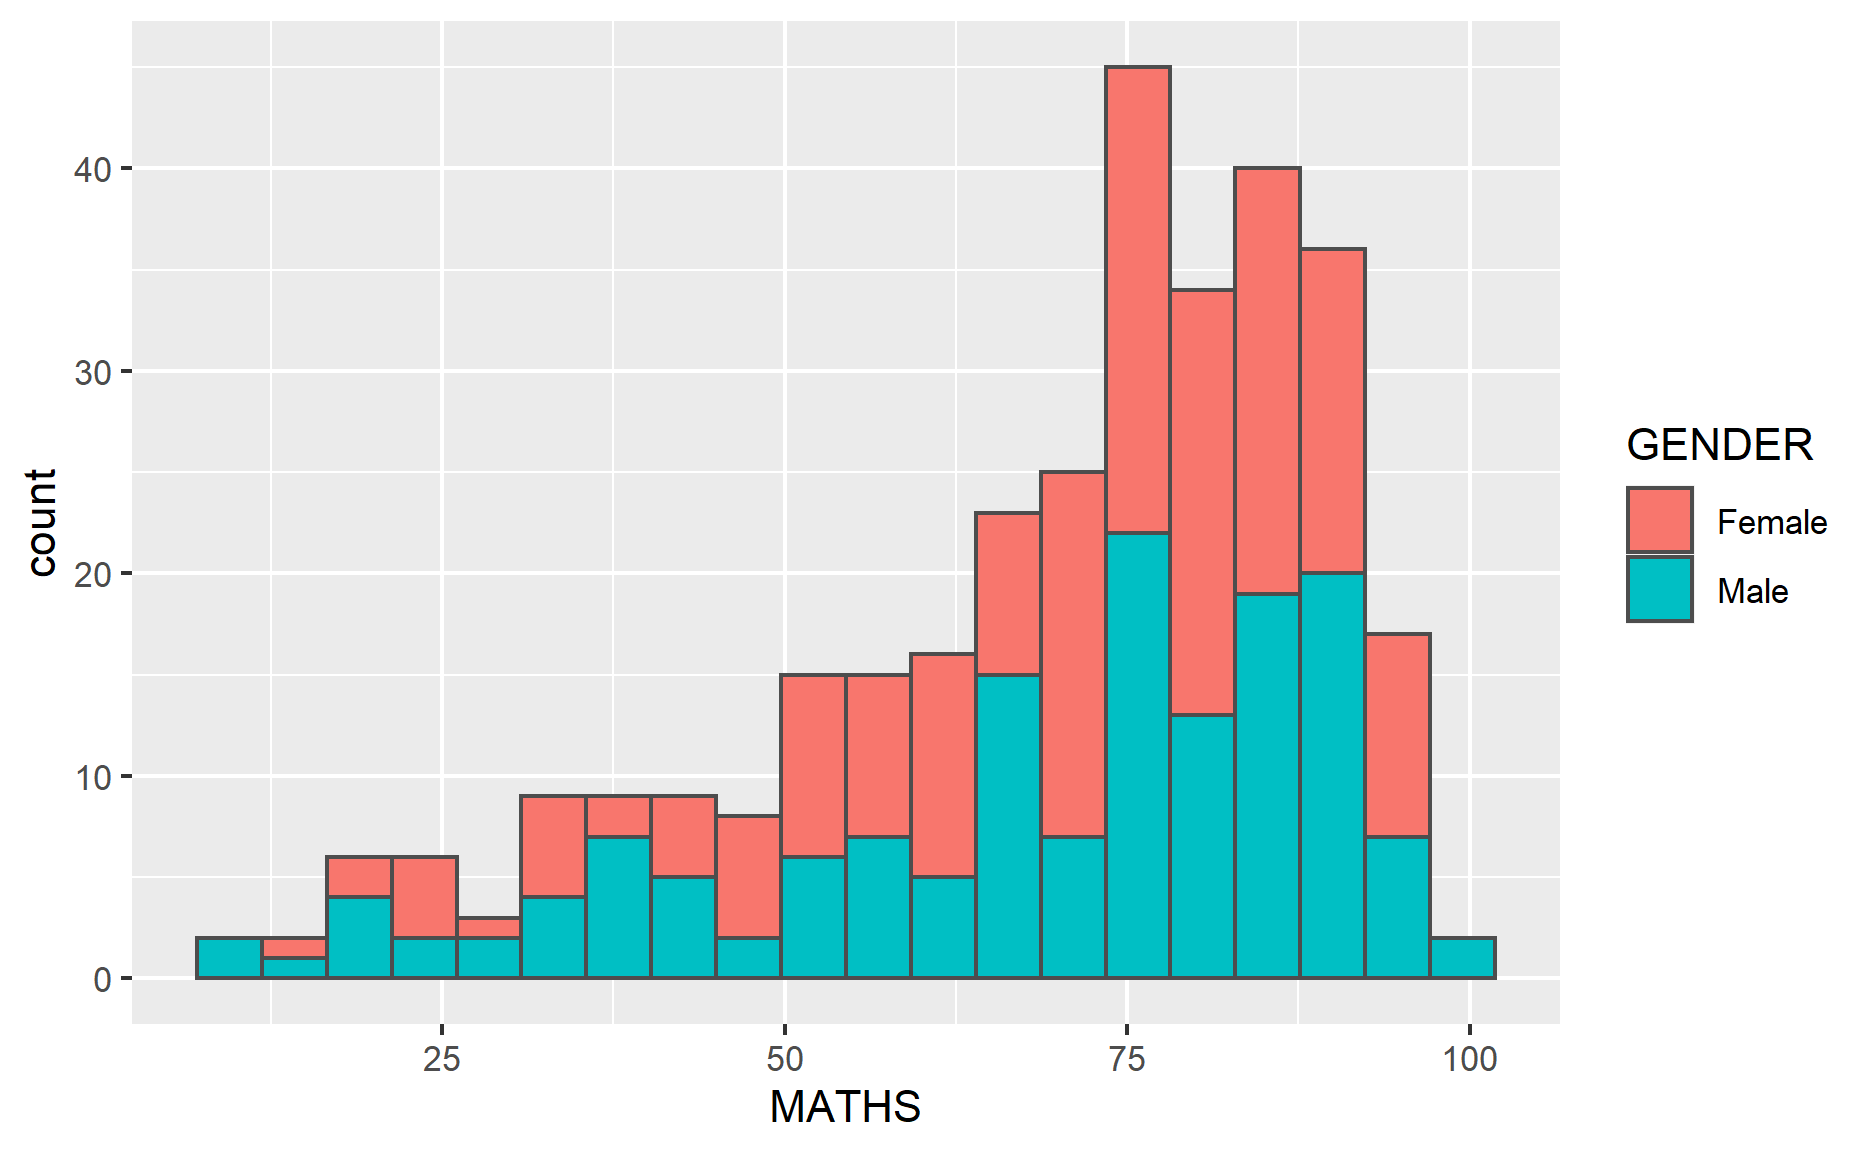
This in-class exercise explores programming data visualisation in R. It introduces the "Grammar of Graphics", ggplot2 for static graphics, ggiraph and plotly for interactive graphics, and tidyverse for the data science workflow.
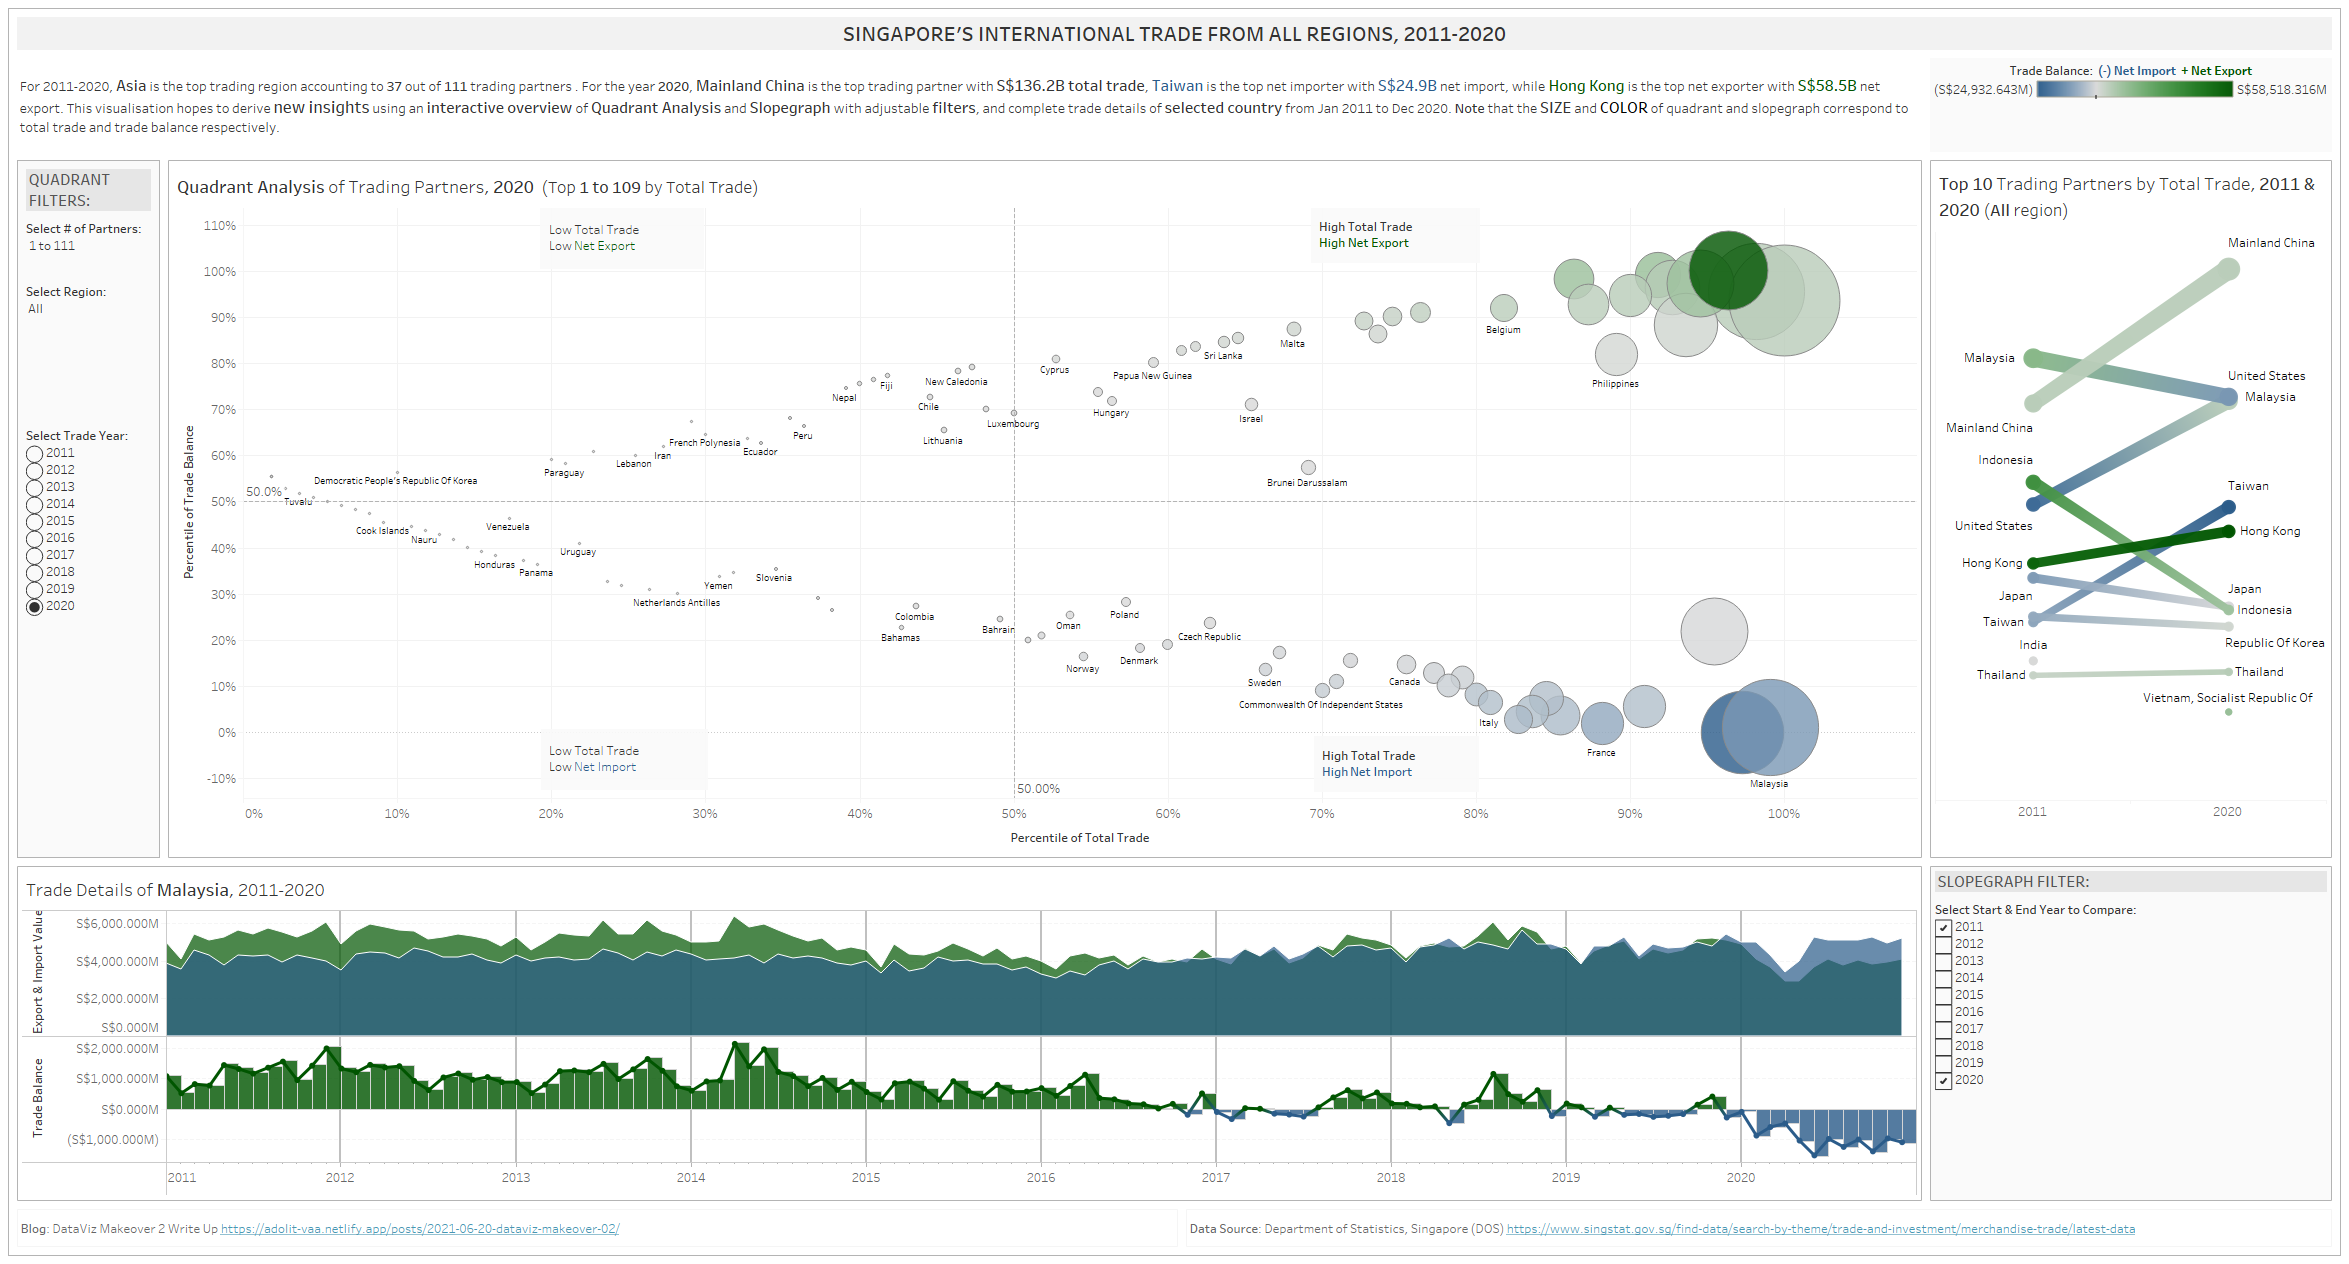
DataViz Makeover 02
The task for this makeover is to design and implement **interactive visualisation** for the infographics by Department of Statistics, Singapore (DOS). The details can be found [here](https://isss608.netlify.app/dataviz/dataviz2). The proposed data visualisation is available on Tableau Public through this [link](https://public.tableau.com/app/profile/adolit/viz/DataViz_Makeover02/SGTradeDashboard).
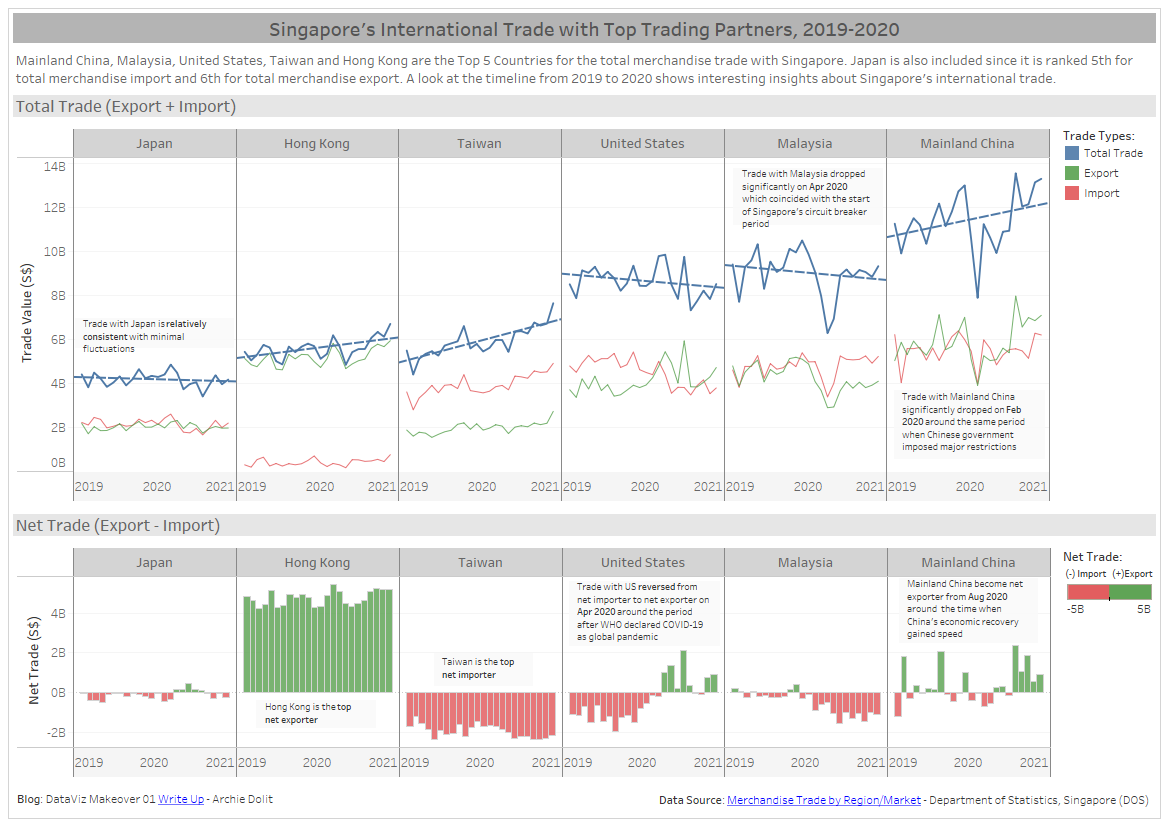
DataViz Makeover 01
The task for this makeover is to design and implement **static visualisation** for the Merchandise Trade by Region/Market data provided by Department of Statistics, Singapore (DOS). The details can be found [here](https://isss608.netlify.app/dataviz/dataviz1). The proposed data visualisation is available on Tableau Public through this [link](https://public.tableau.com/app/profile/adolit/viz/DataViz_Makeover01/Dashboard).